Article by John Tribbia
A note on scope. The numbers here come from synthetic data with known effects baked in from the start. This is not an attempt to backsolve Anthropic’s revenue model. It is a demonstration of how a data team could study a policy change like this without fooling themselves.
A note on measurement. When I say
OAuth intensity, think of the pre-policy share of a user’s prompts or tokens that were routed through OAuth-connected third-party tools. In a real product setting, that is the practical version I would want in the logs, frozen before the rule change.
Anthropic’s April 2026 decision to stop covering third-party OAuth usage under Claude subscriptions looked abrupt. From a unit economics perspective, it was also pretty easy to understand. If a relatively small slice of power users was routing API-like workloads through a flat-rate plan, the problem was never really about optics. It was arithmetic.
This piece borrows the logic from my earlier model-quality analysis. Instead of asking whether better answers make people come back more often, it asks whether pre-policy OAuth intensity predicts who takes the hit when the rule changes.
Same plan, completely different cost world
Two users can both pay for Pro and be nothing alike economically. One opens Claude a few times a week. The other runs a big chunk of a development workflow through an OAuth-connected coding tool. The subscription line is the same. The compute bill is not.
| Segment | OAuth Heavy? | Avg Monthly Rev | Avg Monthly Cost* | Cost/Rev Ratio* | % Unprofitable* |
|---|---|---|---|---|---|
| Developer | Yes | $55.77 | $25.79 | 1.06 | ~40% |
| Business | Yes | $54.89 | $22.61 | 0.93 | ~28% |
| Casual | Yes | $54.80 | $20.84 | 0.87 | ~22% |
| Developer | No | $56.45 | $3.25 | 0.13 | ~0% |
| Business | No | $57.31 | $2.54 | 0.10 | ~0% |
| Casual | No | $56.26 | $1.16 | 0.05 | ~0% |
* Synthetic data only. Cost figures are modeled, not sourced from Anthropic.
In the synthetic data, heavy-OAuth developers are where the stress shows up first. The plan tier does not tell you where the margin problem lives. The usage pattern does.
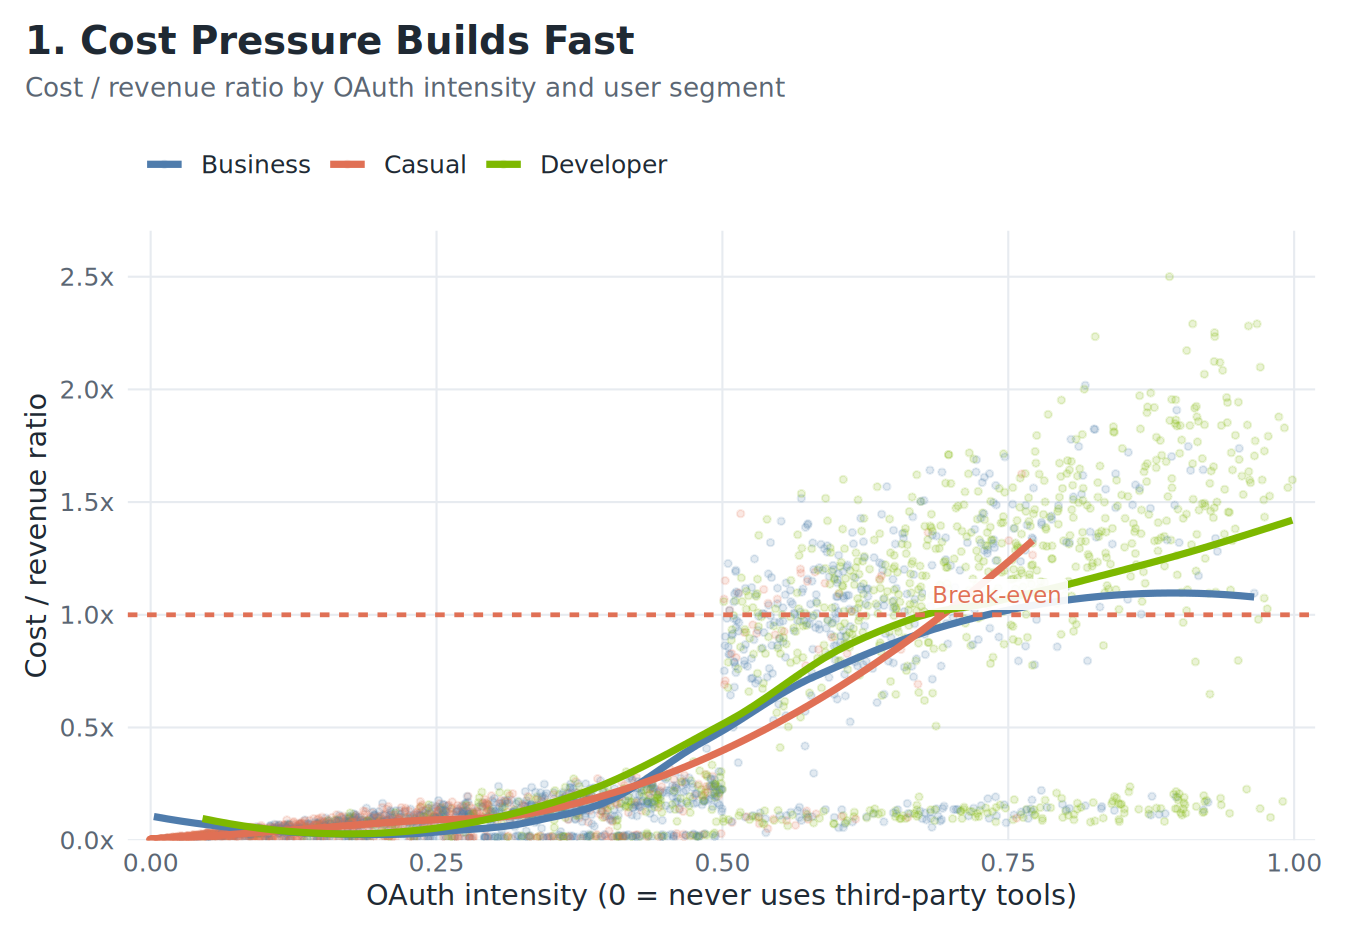
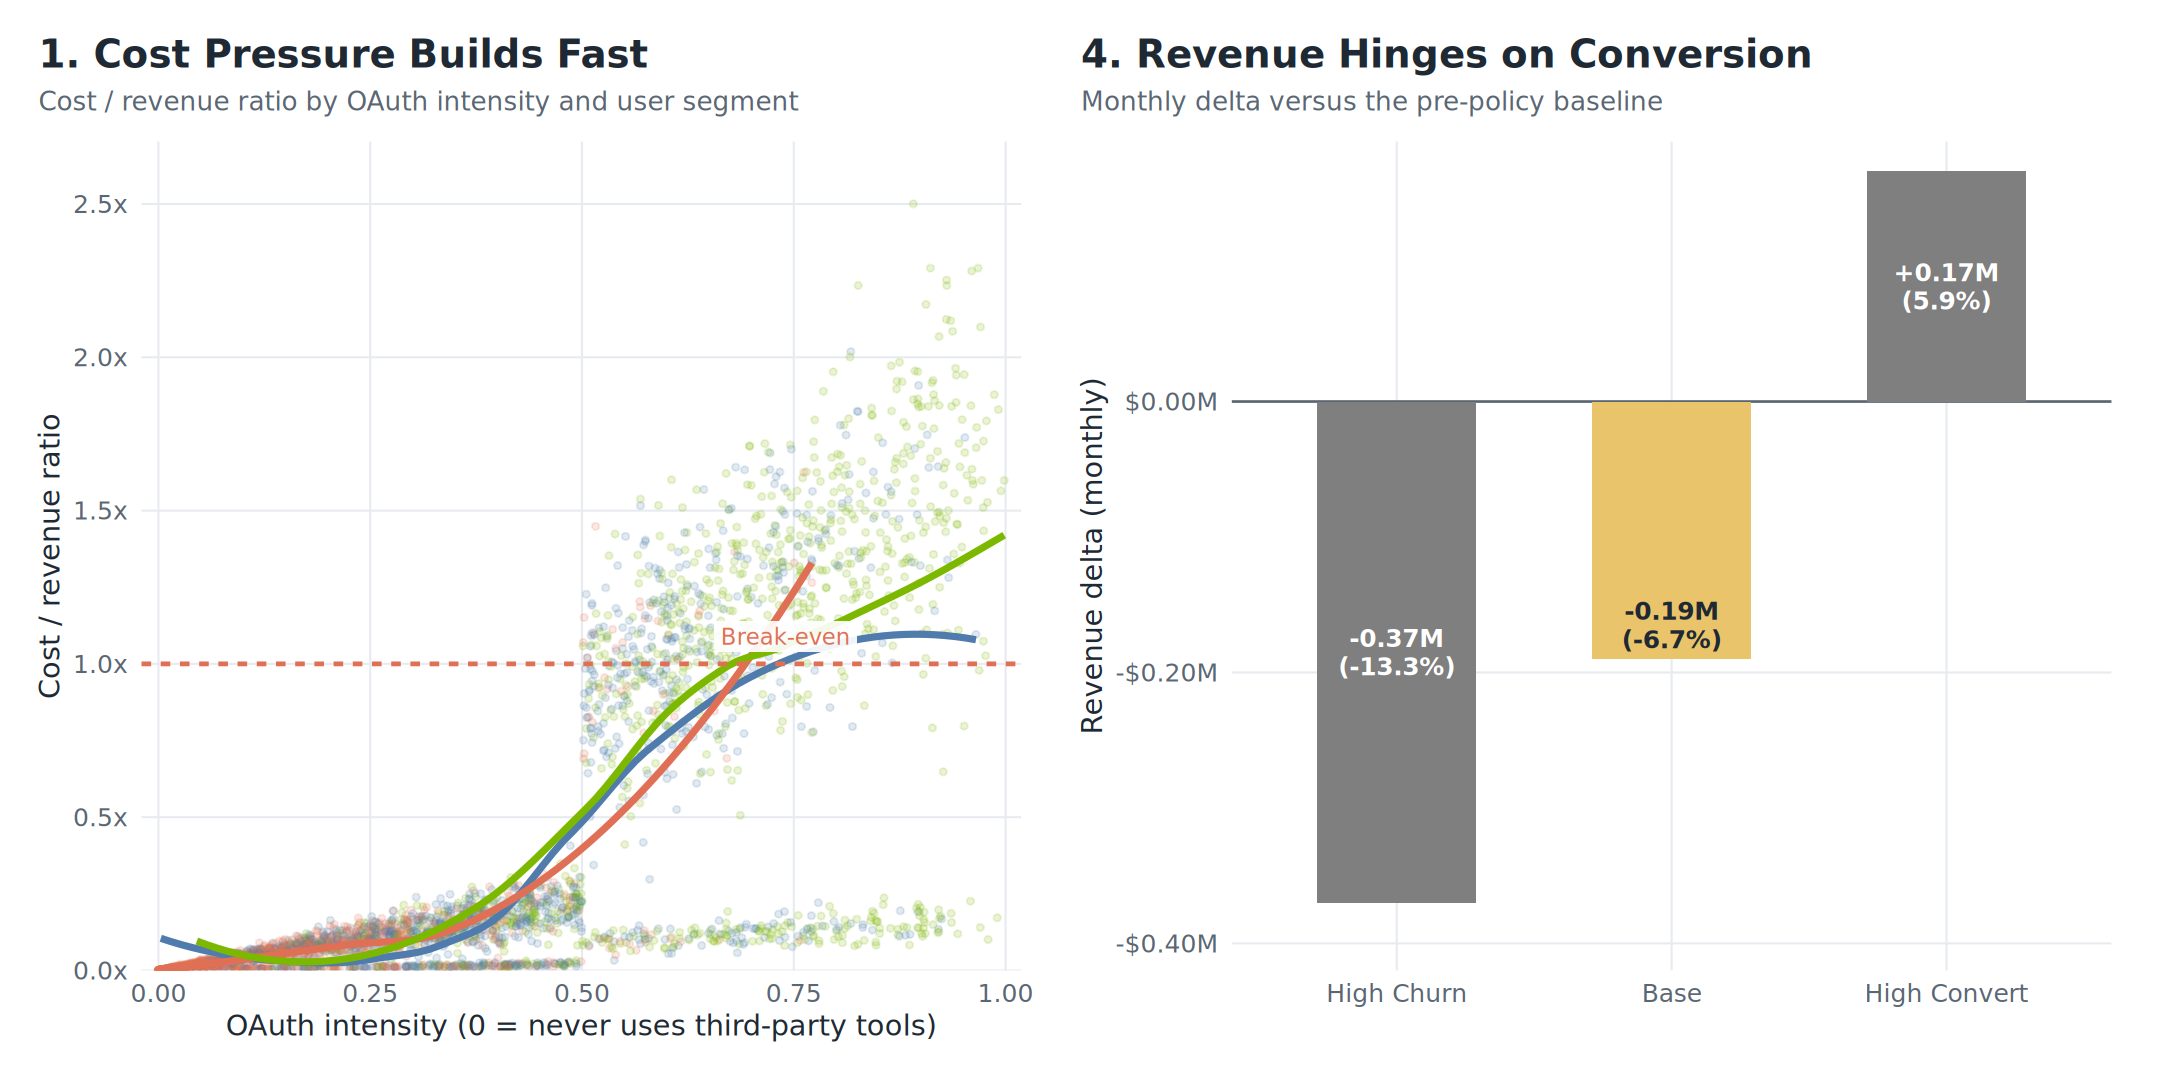
As OAuth intensity rises, the cost/revenue ratio climbs quickly for developer-type users and crosses break-even first.
Why a simple before-and-after read fails
The obvious way to study the policy is to compare churn before and after April 4. That kind of read tells you almost nothing. The announcement arrived with press coverage, social chatter, competitor responses, and a rush of user reactions all at once. A raw before-and-after comparison would credit the whole weather system to one umbrella.
This is the same confounding trap that shows up in model rollout analysis. Deployment boundaries are noisy. Policy boundaries are even worse. If the goal is causal measurement, you need variation that existed before the announcement and only determines exposure to the change.
Freeze the exposure before the announcement
That variation is pre-policy OAuth intensity: in practical terms, the share of prompts or tokens a user was already routing through OAuth-connected tools before Anthropic changed the rules. Some users were structurally dependent on that workflow long before the announcement. Others were barely touched. Measure that behavior early, freeze it, and compare users within the same plan tier.
| Plan | Mean Centered* | SD of Centered Score* |
|---|---|---|
| Pro | 0.000 | 0.276 |
| Max | 0.000 | 0.272 |
* Synthetic data. Mean of zero within each plan confirms the centering is clean.
In the synthetic data, the frozen seven-week estimate is almost perfectly aligned with the full pre-period mean (r = 0.996). That matters because the exposure is not random week-to-week noise. It is a stable feature of how the user works.
For readability, the chart uses a simple heavy-versus-light split. The tighter specification keeps the exposure continuous within each plan tier.
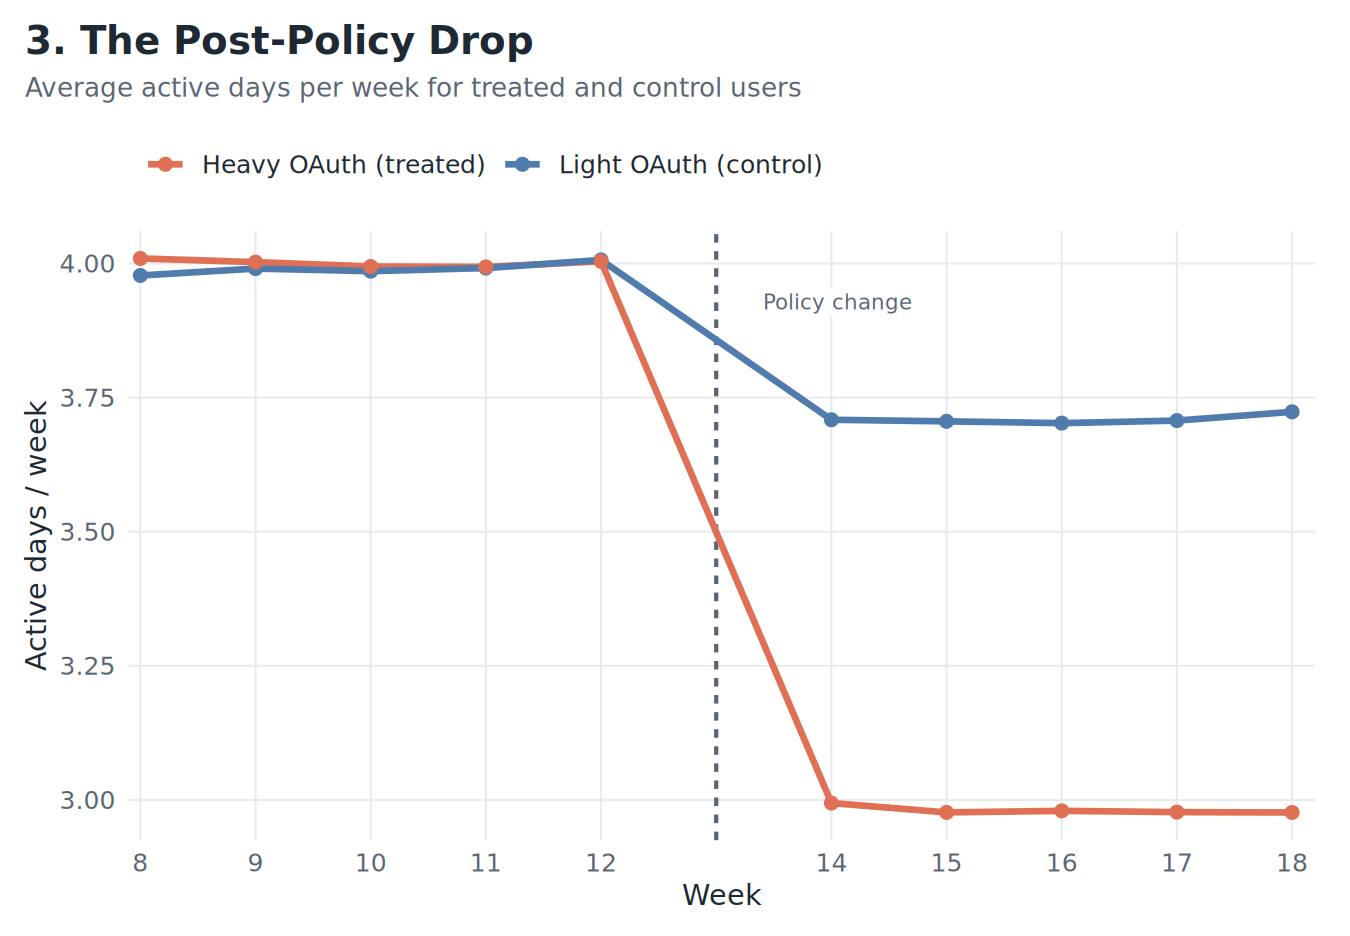
Once you have that exposure measure, the rest is fairly clean: center it within Pro and Max, build a pre/post panel, and estimate a difference-in-differences model. For the simple chart and binary DiD, the control group is light-OAuth users. That is a practical choice, not a perfect one, because some of those users are still a little exposed. The higher-fidelity version is the continuous within-plan estimator, which keeps each user’s frozen pre-policy OAuth share instead of forcing everyone into hard buckets. In the synthetic data, that estimator returns a large negative effect. Users who relied more heavily on OAuth tools lose materially more active days per week after the block lands.
| Model | Coefficient* | Std. Error | t-value | p-value | Interpretation |
|---|---|---|---|---|---|
| Binary DiD (Heavy vs Light) | -0.762 | 0.023 | -33.1 | < 0.0001 | Heavy OAuth users lose ~0.76 active days/week post-policy |
| Continuous (Within-Plan) | -1.038 | 0.040 | -25.8 | < 0.0001 | 1-unit increase in OAuth intensity = 1.04 fewer active days/week |
* Synthetic data. These coefficients recover an injected effect, not an observed one.
What happens next depends on who the user is
Not every affected user does the same thing after the wall goes up.
| Destination | Revenue Impact | Key Driver | Implication |
|---|---|---|---|
| Churn | -$20 to -$200/mo | Casual users; no API need | Retention risk |
| Convert to API | +$65/mo avg | Developers; power users | Expansion opportunity |
| Buy Bundle | +$50/mo | Business; moderate need | Upsell motion |
| Segment | Churned* | Converted to API* | Bought Bundle* | Retained Sub* |
|---|---|---|---|---|
| Developer | 22.6% | 62.6% | 14.8% | N/A |
| Business | 39.1% | 38.8% | 18.1% | 4.0% |
| Casual | 61.3% | 18.8% | 17.6% | 2.3% |
* Synthetic data only. These are injected probabilities, not observed Anthropic figures.
Developers convert at high rates. Casual users walk. Business users split. A go-to-market team needs that breakdown early because the response for each segment is different.
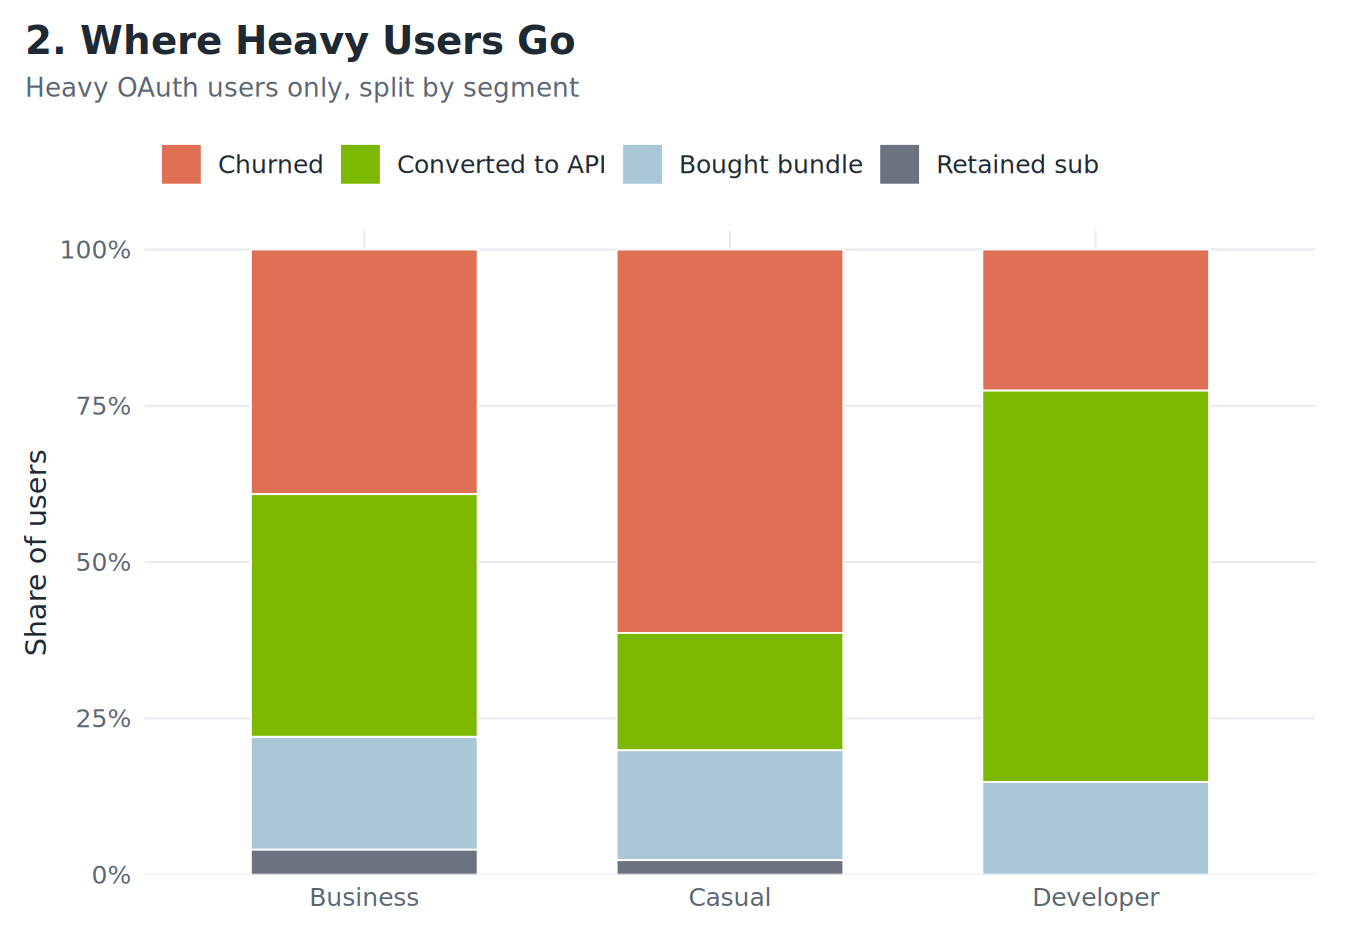
Heavy users do not all disappear. Developers convert at much higher rates than casual users, while casual users are far more likely to walk.
A user who genuinely needs API access and can wire it up in an afternoon is a very different problem from a user who only wanted a convenient flat-rate tool. One group has a workflow dependency that converts cleanly into API revenue. The other just wanted a cheaper way to run a light workload.
Execution determines whether the policy works
Anthropic did not just change what usage is covered. It changed the path users have to take to keep doing the same job.
If the API migration is smooth, the policy can work. If it is clumsy, it becomes a revenue leak and a gift to competitors. In the synthetic scenario model, the policy only turns clearly positive when API conversion gets high enough to offset churn.
| Scenario | P(Churn) | P(Convert to API) | P(Bundle) | Monthly Rev Delta* | % Change* |
|---|---|---|---|---|---|
| Bear: High Churn | 55% | 25% | 20% | -$0.38M | -13.5% |
| Base: Balanced | 42% | 40% | 18% | -$0.19M | -6.7% |
| Bull: High Convert | 20% | 60% | 20% | +$0.14M | +5.0% |
* Synthetic data, illustrative only.
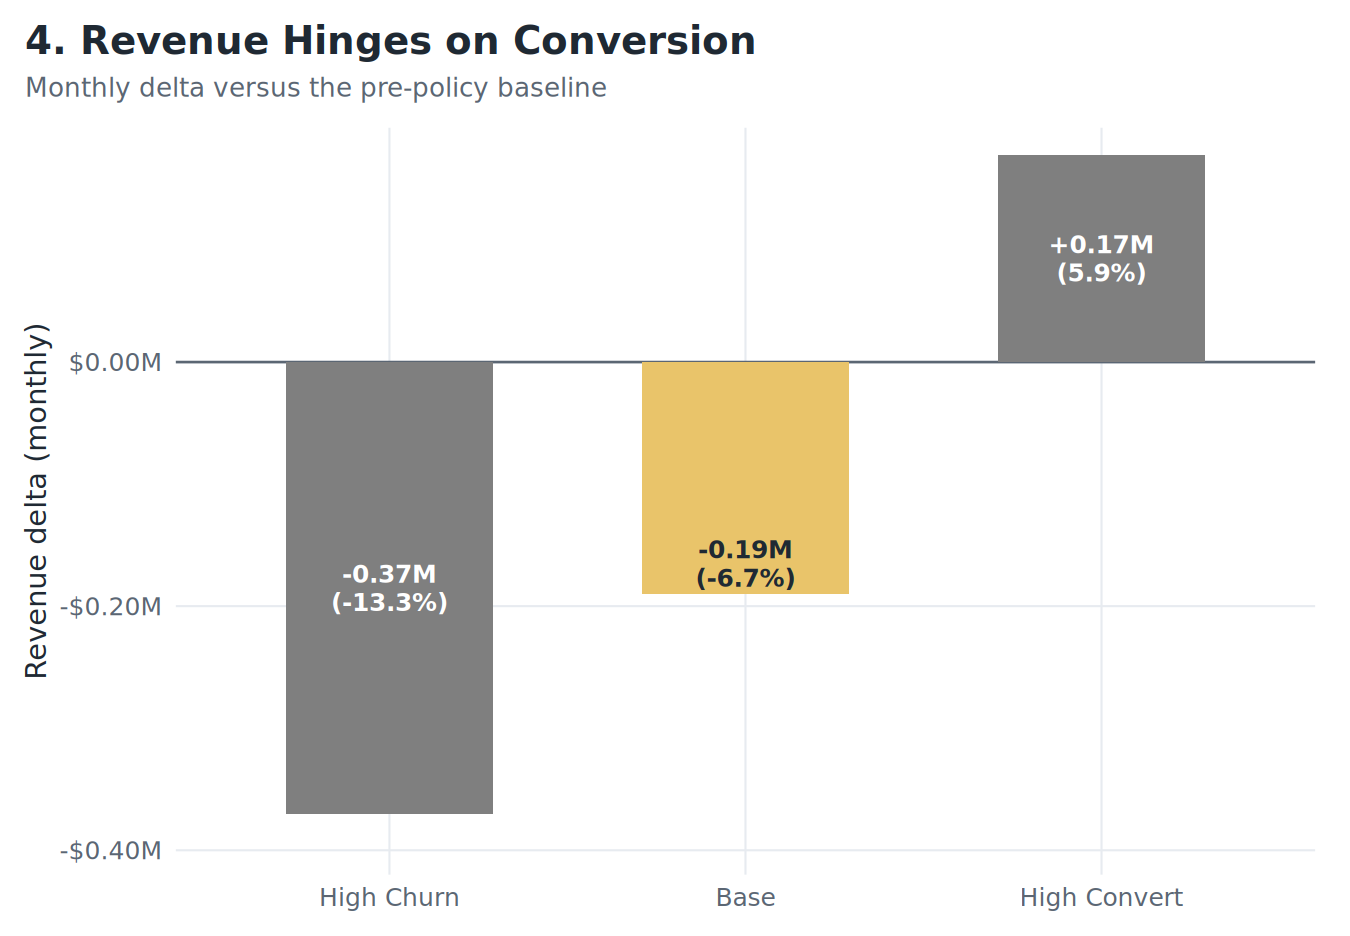
The outcome turns on conversion execution, not just the price sheet.
Documentation, migration flow, credits, bundling, and onboarding carry more weight than the announcement copy once the decision is made.
Where this logic applies
This logic is not specific to Anthropic or OAuth. The same approach works whenever a product or pricing change hits users differently based on how they actually use the product: tier migrations, feature sunsets, pricing shifts, even model rollouts with uneven value across tasks.
Running the regression is tractable. Getting the behavioral data logged before the decision lands is where most analyses break down. If you have it, you can tell who actually took the hit and who was just standing nearby when the news cycle exploded. You can also be honest about the tradeoff between a readable heavy-versus-light comparison and the higher-fidelity continuous exposure model underneath it.
What the data shows
You do not learn much by staring at the date the policy landed. You learn more by finding the user-level exposure that was already there before the shock, freezing it, and letting that carry the identification.
If heavy third-party OAuth users were the group breaking flat-rate subscription economics, Anthropic’s move was not arbitrary. It was arithmetic.
All data in this post is synthetic. The R script that generated the figures lives alongside this post in the site repo.
Ideas, analysis, and opinions are my own. Generative AI was used as an editor after the writing and analysis were complete — sentence restructuring and light copy-editing. The author reviewed all suggested changes.