Article by John Tribbia
Picture a 14-year-old who opens a learning app every day for two months. On a retention chart she looks like a success. She might be working through problems each night. She might also be tapping in for a minute before bed to keep a streak going. Both show up in the logs as a returning user.
Most teams reach for retention first because it’s easy to compute. My view is that for young learners it can’t settle the question by itself, since a kid who keeps coming back may be learning or may just have a habit, and the retention number is the same either way.
To test that, I built a fake product with two features and a known answer. One is a daily streak with reminders. The other is a guided mode where the assistant asks scaffolding questions instead of handing over answers. I rolled them out in waves, the way real products usually ship, and tried to recover what each one did using a four-layer scorecard instead of retention alone.
What this is. None of this is real user data. I generated it from a mechanism I defined, so I can check every estimate against the truth, and the effect sizes are made up and shouldn’t be quoted. What carries over to real products is the measurement problem: nobody flipped a coin, the calendar is the school year, and the outcome you care about isn’t the one the logs record. I left out under-13 users on purpose and I’m not touching policy or safety questions, since this is a value and growth analysis.
The setup
The simulation has 200 clusters of 200 learners each, which you can think of as schools or after-school programs. Half the clusters get the streak feature and half get guided mode. Within each half, 25 clusters go live in week 5, 25 in week 9 and 25 in week 13, and the last 25 haven't been reached by week 20. Learners fall into three age bands: 13–15 (30%), 16–17 (30%) and 18+ (40%). The two younger bands follow the school calendar closely, with an exam bump in weeks 9–10, a winter-break dip in weeks 15–16 and another exam bump near the end, while adults barely move with it.
The waves aren't random. Clusters with higher baseline engagement go first, as they would in a real rollout that starts with the schools whose teachers asked for it. Early-wave clusters sit about 0.29 logit points above average on baseline engagement and the last group sits 0.33 below, which is the kind of gap a randomized holdout would have removed and this design has to handle some other way.
Not everyone who is exposed uses the feature. About 70% of 13–15 learners adopt streaks against 30% of adults, and about 44% of 13–15 learners adopt guided mode against 59% of adults. Effects apply only to adopters, so adoption shapes every result below.
To keep learning separate from visits, each learner has a hidden skill level that grows with practice, and a normal active day adds a fixed amount. The streak feature adds extra active days, but I made those days worth a quarter as much and only a fifth of them end with a completed task. Guided mode barely changes how often people show up. It raises what an active day is worth by 70 to 110 percent for adopters, depending on age, and it raises the share of days that finish a task.
A scorecard with four layers
I measure each feature at four layers and read them separately for each age band, since the same number can mean different things at 14 and at 24.
| Layer | Question | Measure | What changes by age |
|---|---|---|---|
| Activation | Did exposed learners actually start using it? | Share of exposed learners who adopt | Teens take up streaks readily, adults mostly ignore them |
| Task success | Do sessions end with something finished? | Completed tasks per active day | Same definition, but a 13-year-old's task is shorter than an adult's |
| Learning progress | Is the learner getting better at the thing? | Score on a short checkpoint, in SD units | Needs an age-appropriate assessment, and a single quiz won't do |
| Durable retention | Are they still coming back, weeks later? | Weekly active rate and active days per week, 6–8 weeks after launch | Daily use is a habit signal for teens and a heavy-use signal for adults |
The learning checkpoint is shown to a random half of learners each week, whether or not they were active. If it were an opt-in quiz, engaged people would take it, and a feature that changes who is engaged would change who takes the quiz as well. Randomizing who sees it costs some precision and avoids that.
Why the obvious comparisons fail
Without a holdout, two comparisons come to mind first. You can compare a cluster to its own past, or you can compare clusters that have the feature to clusters that don't. Here they fail in opposite directions.
Comparing treated clusters to untreated ones mixes the feature with the fact that the early clusters were already more engaged. For streaks among 13–15 learners that comparison says the feature added 17.5 points of weekly activity. Comparing a cluster to its own past mixes the feature with the calendar and with background drift in engagement, and it says streaks added 2.2 points. Because I wrote the simulation, I can compute the true effect, and it is about 9 points.
What I used instead
The fix is difference-in-differences with a not-yet-treated comparison group. For each launch wave, I take the change in a cluster's outcome from the week before launch to a later week and subtract the same change for clusters that hadn't launched by that later week. The calendar hits both groups the same way and the level gap between them cancels, which leaves the feature. I average across waves and resample whole clusters 200 times for the intervals.
The assumption doing the work is parallel trends, meaning that without the feature the early clusters would have moved the way the later ones did. I can't prove that, but the weeks before launch give some evidence, since the estimated effect there should be zero and it is.
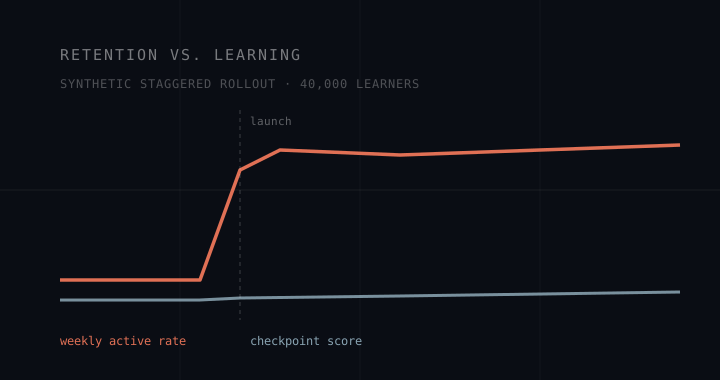
The streak panels are the ones I'd show a skeptical product manager. Weekly activity rises about 10 points and stays up through the ten weeks I can observe, which is the shape most launch reviews hope for, and learning measured the same way doesn't follow it.
The scorecard
Here is every feature and age band across the four layers, measured 6 to 8 weeks after exposure. Activation is the adoption rate among exposed learners and the other columns are estimated effects with 95% intervals.
| Feature · age | Activation | Task success (pp) | Learning (SD) | Active rate (pp) | Active days / wk |
|---|---|---|---|---|---|
| Streaks · 13–15 | 70% | −9.5 ± 2.0 | +0.05 ± 0.06 | +10.2 ± 1.8 | +0.83 ± 0.07 |
| Streaks · 16–17 | 65% | −7.4 ± 1.6 | +0.04 ± 0.05 | +8.9 ± 1.6 | +0.67 ± 0.06 |
| Streaks · 18+ | 30% | −0.1 ± 1.6 | +0.07 ± 0.05 | +1.8 ± 1.3 | +0.04 ± 0.05 |
| Guided · 13–15 | 44% | +7.3 ± 2.0 | +0.14 ± 0.06 | +2.6 ± 1.8 | +0.07 ± 0.06 |
| Guided · 16–17 | 44% | +4.8 ± 2.1 | +0.07 ± 0.05 | +4.0 ± 1.8 | +0.02 ± 0.06 |
| Guided · 18+ | 59% | +9.1 ± 1.4 | +0.24 ± 0.05 | +5.4 ± 1.7 | +0.30 ± 0.05 |
Ranked by active rate, streaks beat guided mode by about four to one among 13–15 learners. Ranked by task success the order flips. Streaks lower the share of active days that finish a task by almost 10 points, because the extra days are short check-ins, while guided mode raises it by 7. Learning points the same way as task success, although for 13–15 the gap between the two features (0.05 versus 0.14 SD) is within the noise. I wouldn't decide on learning alone for that age band, but task success and learning together agree, which is why I want more than one layer.
The age split matters as well. Most adults don't adopt streaks, so streaks do little for them, and guided mode is the stronger feature for adults on every layer. The tradeoff shows up in the two younger bands, and a single blended number would bury it.
How much the naive read gets wrong on learning
Learning is where the naive comparisons do the most damage. Everyone in the simulation improves over time, so a before-and-after comparison credits the feature with ordinary growth.
A team using before and after would conclude that streaks produced a quarter of a standard deviation of learning, about what guided mode does for adults. In the simulation streaks produced almost none of it. Learners were improving with time regardless.
Where this can still be wrong
Parallel trends is an assumption, so I tested what happens when it fails. If early-wave clusters were trending up faster than later ones by 0.01 logit points a week, the streak retention estimate for 13–15 learners rises to 12.5 points against a true effect of about 9. The guided-mode estimate for 16–17 learners goes from 4.0 to 6.5 points when the true effect is about 1. Biases of 3 to 5 points are as large as the guided-mode retention effects I'm trying to measure, so small retention differences deserve a lot of caution.
Learning has a related problem. Skill accumulates, and engaged clusters accumulate it faster, so early clusters would have pulled ahead a little even without the feature. The learning estimates sit above the true values in all six cells by 0.01 to 0.07 SD. For adults on streaks, a true effect of zero shows up as +0.07 with an interval that just excludes zero. The pre-launch check didn't flag this. Modeling each cluster's pre-launch growth rate would probably fix it, and I haven't done that here.
The simulation also simplifies in other ways. Adopters are a fixed trait here, while a real product would have to infer who is actually using the feature. Learners within a cluster don't influence each other, which breaks down once siblings or classmates share accounts or compete on streaks. A short checkpoint is a crude measure of learning, and the streak effect never fades, though real streak features often do.
What I'd recommend
For adults the answer is simple, because guided mode wins on every layer and most of them ignore streaks anyway. For 13–17 I wouldn't choose between the two features on retention, since retention alone would pick streaks. I'd ship guided mode where it improves task success and learning, and I'd keep streaks only if the team values the habit for its own sake. I'd also redesign the streak so that it counts only days with a completed task, which makes the extra days contain real work. That change can be tested the same way in the next wave, with the same four layers.
If I could add one instrument, I'd add a checkpoint calibrated by age band and shown to a random sample of learners every few weeks. It's the cheapest layer on the scorecard to build, and it's the one the other layers get checked against.
scripts/learner_value_analysis.py. Results: content/data-projects/learner-value/data/results.json. Cluster-by-segment-by-week panel: cluster_week_panel.csv (12,000 rows, seed 42).Method notes. Estimates follow a Callaway–Sant'Anna-style design: for each launch wave g and week t, the change from week g−1 to week t is compared between wave-g clusters and clusters not yet treated at t (or ever treated), then averaged across waves weighted by cluster count. Intervals are 1.96 × the standard deviation of 200 cluster bootstrap replicates. "Durable" window is weeks 6–8 after exposure (the 13th-week wave contributes weeks 6–7 only). Task success is completed tasks divided by active days. Learning is the mean checkpoint score in a cluster-week among a random 50% sample of learners, with measurement noise of 0.4 SD. The true effects come from the counterfactual paths in the same simulation, averaged over treated learner-weeks in the same window. The robustness check adds 0.01 logit/week of extra trend to early-wave clusters.
Ideas, analysis, and opinions are my own. Generative AI was used as an editor after the writing and analysis were complete — sentence restructuring and light copy-editing. The author reviewed all suggested changes.